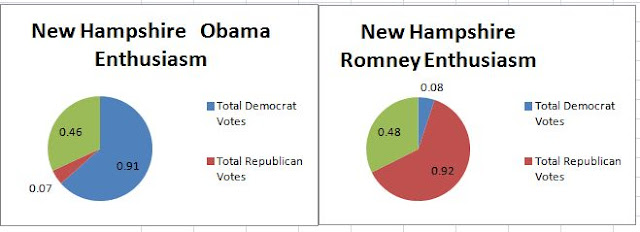
2012 NEW HAMPSHIRE ELECTION PROJECTION
| 2012 NEW HAMPSHIRE ELECTION PROJECTION | ||||||||||
Polling
Averages
| ||||||||||
O
|
R
|
O
|
R
|
O
|
R
|
O
|
R
|
O
|
R
| |
Total Democrat
Votes
|
0.91
|
0.09
|
0.87
|
0.13
|
0.93
|
0.04
|
0.94
|
0.04
|
0.91
|
0.08
|
Total
Republican Votes
|
0.03
|
0.95
|
0.10
|
0.89
|
0.05
|
0.93
|
0.09
|
0.89
|
0.07
|
0.92
|
Total
Independent Votes
|
0.48
|
0.50
|
0.51
|
0.43
|
0.36
|
0.49
|
0.49
|
0.48
|
0.46
|
0.48
|
| Party Affiliation | |||
Dems
|
0.406
|
0.287
|
34.7%
|
Repub
|
0.442
|
0.329
|
38.6%
|
Ind
|
0.152
|
0.384
|
26.8%
|
| Projected Results | |||
Turnout
|
Obama
|
Romney
| |
Total Democrat Votes
|
239,085
|
218,165
|
17,931
|
Total
Republican Votes
|
265,995
|
17,955
|
243,385
|
Total
Independent Votes
|
184,920
|
85,063
|
87,837
|
Total Voter
Turnout
|
690,000
|
321,183
|
349,154
|
46.5%
|
50.6%
|


0 Comments:
Post a Comment
<< Home